The Relationship Between the Time Value of Money, Fixed Income, and the Term Structure of Interest Rates
The time value of money (TVM) is a financial concept that recognizes the idea that a sum of money today is worth more than the same amount in the future. This is based on the premise that money can earn interest or have investment potential over time.
What is TVM?
The time value of money is a fundamental principle in finance and is used in various financial calculations and decision-making processes. There are two main components of the time value of money:
Present Value (PV): Present value is the current worth of a future sum of money, discounted at a specific interest rate. It represents the amount of money you would need to invest today to have a certain amount in the future.
Future Value (FV): Future value is the value of a sum of money at a specific point in the future, assuming a certain interest rate. It represents the amount of money that an investment will grow over time.
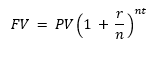
Where:
- FV = Future Value
- PV = Present Value
- r = Annual Interest Rate
- n = Number of times that interest is compounded per year
- t = Number of years the money is invested or borrowed for
If the interest is compounded annually, n=1, the formula simplifies to:
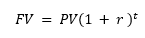
These formulas illustrate the concept that the value of money changes over time due to the opportunity to earn interest or return on investments. An interest rate is the cost of borrowing money or the return on investment expressed as a percentage of the principal amount. In other words, it is the compensation paid by borrowers to lenders for the use of their money or the reward earned by investors for providing funds.
Applications of TVM
The time value of money is relevant in various financial calculations, including:
- Net Present Value (NPV): Evaluating the profitability of an investment by comparing the present value of cash inflows and outflows.
- Internal Rate of Return (IRR): Determining the discount rate that makes the present value of future cash flows equal to the initial investment.
- Loan Amortization: Calculating the monthly payments on a loan, where each payment consists of both principal and interest.
- Valuation of Bonds and Stocks: Assessing the fair value of financial instruments based on future cash flows.
Now let's delve into specific types of fixed-income instruments.
A bond is a debt security that represents a loan made by an investor to a borrower, typically a government or a corporation. When you purchase a bond, you are essentially lending money to the issuer in exchange for periodic interest payments and the return of the principal amount at maturity. Bonds are considered fixed-income securities because they pay a fixed amount of interest over a specified period.
Some key features of bonds:
- Face Value (Par Value): The face value, or par value, is the nominal value of the bond, and it represents the amount that will be repaid to the bondholder at maturity.
- Coupon Rate: The coupon rate is the fixed annual interest rate paid by the bond issuer to the bondholder. It is expressed as a percentage of the face value. For example, a bond with a face value of $1,000 and a coupon rate of 5% will pay $50 in annual interest.
- Maturity Date: The maturity date is the date on which the bond issuer is obligated to repay the principal amount to the bondholder. Bonds can have short-term or long-term maturities, ranging from a few months to several decades.
- Issuer: Bonds can be issued by governments, municipalities, corporations, and other entities to raise capital for various purposes, such as financing infrastructure projects, expanding operations, or managing cash flow.
- Yield (Yield to Maturity): The yield to maturity (YTM) of a bond is a measure of the total return an investor can expect to receive if the bond is held until it matures. YTM takes into account not only the periodic interest payments (coupon payments) but also any potential capital gains or losses based on the difference between the bond's current market price and its face value at maturity. Investors use YTM to compare the relative attractiveness of different bonds and to assess their potential returns. If the YTM is higher than the current yield or coupon rate, the bond is priced at a discount; if it's lower, the bond is priced at a premium. If the YTM is equal to the coupon rate, the bond is priced at par value.
- Market Price: The market price of a bond can fluctuate based on changes in interest rates, credit risk perceptions, and market conditions. Bonds may trade at a premium (above face value) or a discount (below face value).
Bonds provide investors with a predictable stream of income through interest payments and return of principal at maturity. They are considered relatively safer investments compared to stocks but still carry risks, such as interest rate risk and credit risk. Investors often include bonds in their portfolios to achieve diversification and manage risk.
Let’s explore how these bonds are priced based on their yield.
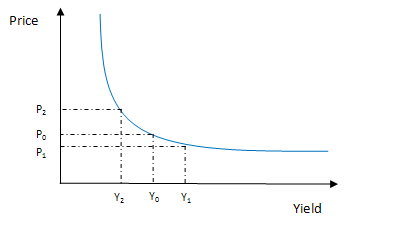
The relationship between the price and yield of a bond is inverse and is often referred to as the "price-yield relationship" or the "price-interest rate relationship." This relationship is fundamental to understanding how changes in interest rates impact the value of bonds in the secondary market.
Bond prices and yields move in opposite directions. When interest rates (yields) in the market rise, bond prices tend to fall, and vice versa. As interest rates rise, the market value of existing bonds falls because investors can obtain higher yields from newly issued bonds. Conversely, when interest rates decline, existing bonds may appreciate in value.
To further understand bond pricing dynamics, we need to examine interest rate curves.
An interest rate curve, often referred to as a "yield curve," is a graphical representation of the relationship between interest rates (or yields) and the time to maturity of fixed-income securities. This graph is also called the term structure of interest rates
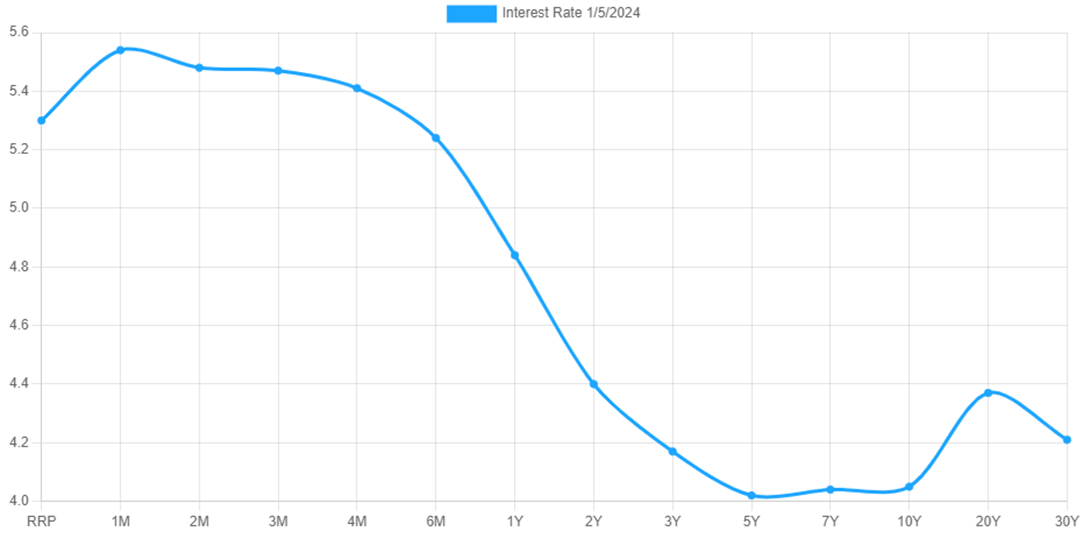
Here’s how the US Treasuries Yield Curve looks as of 5th Jan 2024:
Source: https://www.ustreasuryyieldcurve.com
Factors Influencing the Term Structure:
- Expectations of Future Interest Rates: The term structure is influenced by market expectations regarding the future direction of interest rates. If investors expect rates to rise, the yield curve may slope upward; if they expect rates to fall, it may slope downward.
- Risk and Uncertainty: Investors demand a premium for holding longer-term securities due to increased uncertainty and risk associated with a longer time horizon.
- Economic Conditions: Economic indicators, inflation expectations, and overall economic health can impact the shape of the yield curve.
In summary, fixed-income securities are an essential component of financial markets, and understanding their pricing dynamics is crucial for investors. The time value of money and interest rates are fundamental concepts that underpin the pricing of fixed-income instruments.
Fixed-income bonds, such as government and corporate bonds, offer investors a way to diversify their portfolios. The relationship between a bond's price and its yield is inverse, and changes in interest rates can significantly impact bond prices. Interest rate curves, including the term structure of interest rates and yield curve, provide valuable insights into market expectations and investor sentiment. Factors such as inflation expectations, monetary policy, and market sentiment influence interest rate curves. By comprehending these concepts, investors can make informed decisions about their investment strategies.